MoneyWorks Manual
Composite Charts
Individual columns can override the chart type setting by appending the column label with “|x”, where”|” is the “pipe” character and x is one of:
| C | Column with black border |
| c | Column with no border |
| S | Stacked |
| L | Line with data points |
| I | Line with no data points (lower case L) |
| P | Pie (useful for only one column) |
| M | 9-month moving average |
| Mn | n-month moving average, where n is 1..9 |
The “|x” text will be removed from the label and not appear on the chart.Thus
"\tBLOGGS|S\tJONES|S\tWHITE|S\nJan\ ..."
will force a stacked column graph, regardless of the Type setting in the report part. More interestingly, in:
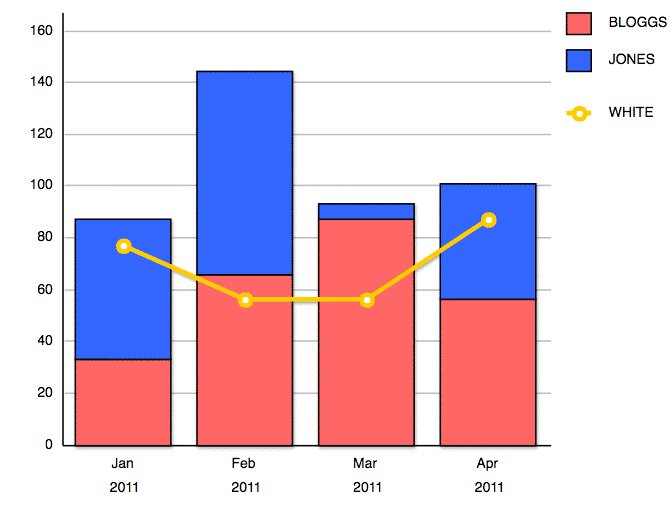
"\tBLOGGS|S\tJONES|S\tWHITE|L\nJan\ ..."
the “|L” in the WHITE label generates a line graph, giving a composite graph:
Splitting the column labels
A colon in a column label will split the label into two lines, allowing (for example) the month and year name to be on separate lines, as shown above, where the month labels were changed to end in “:2011”:
"Jan:2011\t33\t54\t77\nFeb:2011\t..." etc:
You can get category divisions by only including the “:division” part for the first category of each division. The “division” label will be cunningly centred under its related categories. If there are too many categories to fit, only the division labels will show.