MoneyWorks Manual
Anatomy of an Analysis Report
An analysis report will produce what is basically a cross tabulation (or cross tab) of selected transaction or job sheet information. Cross tabs are commonly used to collate data for decision making purposes.
When you create an analysis report you specify which is the source file. When the analysis is done every transaction detail record (or job sheet item) in the nominated time interval that uses one of the selected source records is located. The summary information (e.g. count, quantity, net) from the detail or job sheet records is calculated and summarised.
In the following we are doing a Product by Customer analysis, i.e. who has purchased the specified products:
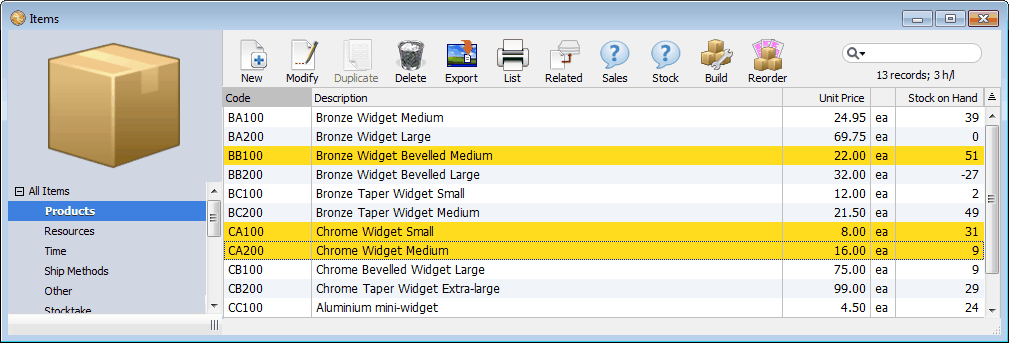
1. The source file is determined by what information is required. Here we require sales information by product, so the source file is Products. Three products have been highlighted to analyse.

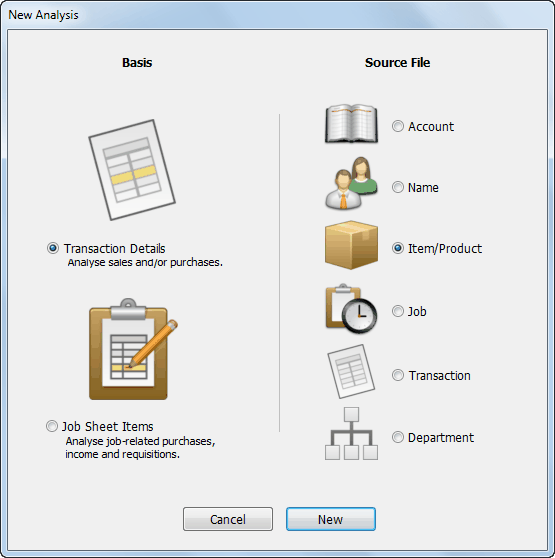
2. Choosing New Analysis from the New hierarchical menu in the File menu displays the New Analysis window in which the source and base files are selected. Here we want the source file to be Item/Product, as this is our starting point.

3. Clicking New displays the analysis definition window in which the details of the analysis are specified. The following schematic shows how this works.
