Viewing the analysis as a list is only one of four ways the analysis can be displayed. The Report view is a slightly altered form of the list view (try setting the Arrange As option to Report and look at the report).
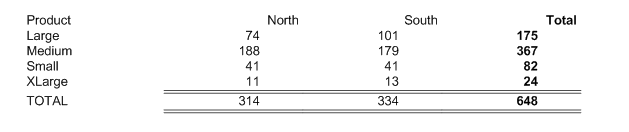
In the table format one field is displayed horizontally across the page, with the remainder displayed vertically down the page. Only one calculation can be shown on the report itself.
Change the Arrange As option to Table
Notice that only one calculation value (currently quantity) can be used.
Preview the analysis
Drill Down
From the preview of an analysis report, you can drill down on a data point to see the underlying records.
Move the cursor over one of the table values (but not a total) until it turns into a magnifying glass, and click
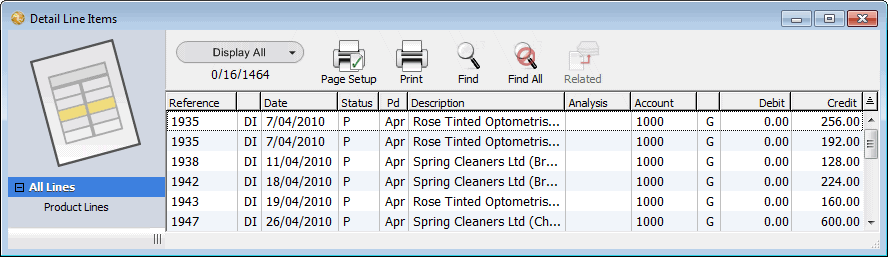
The Detail Line Items list window will be displayed with just the lines of the transaction that comprise the results.
Close the Detail Lines list window, then the preview window